
Knowing where you stand
Reports
Menu: Reporting → Reports · Who: owner, branch manager
A cashier cannot open this page. A branch manager always sees a branch they run — whatever they ask for, they are answered about one of their own.
Using the page
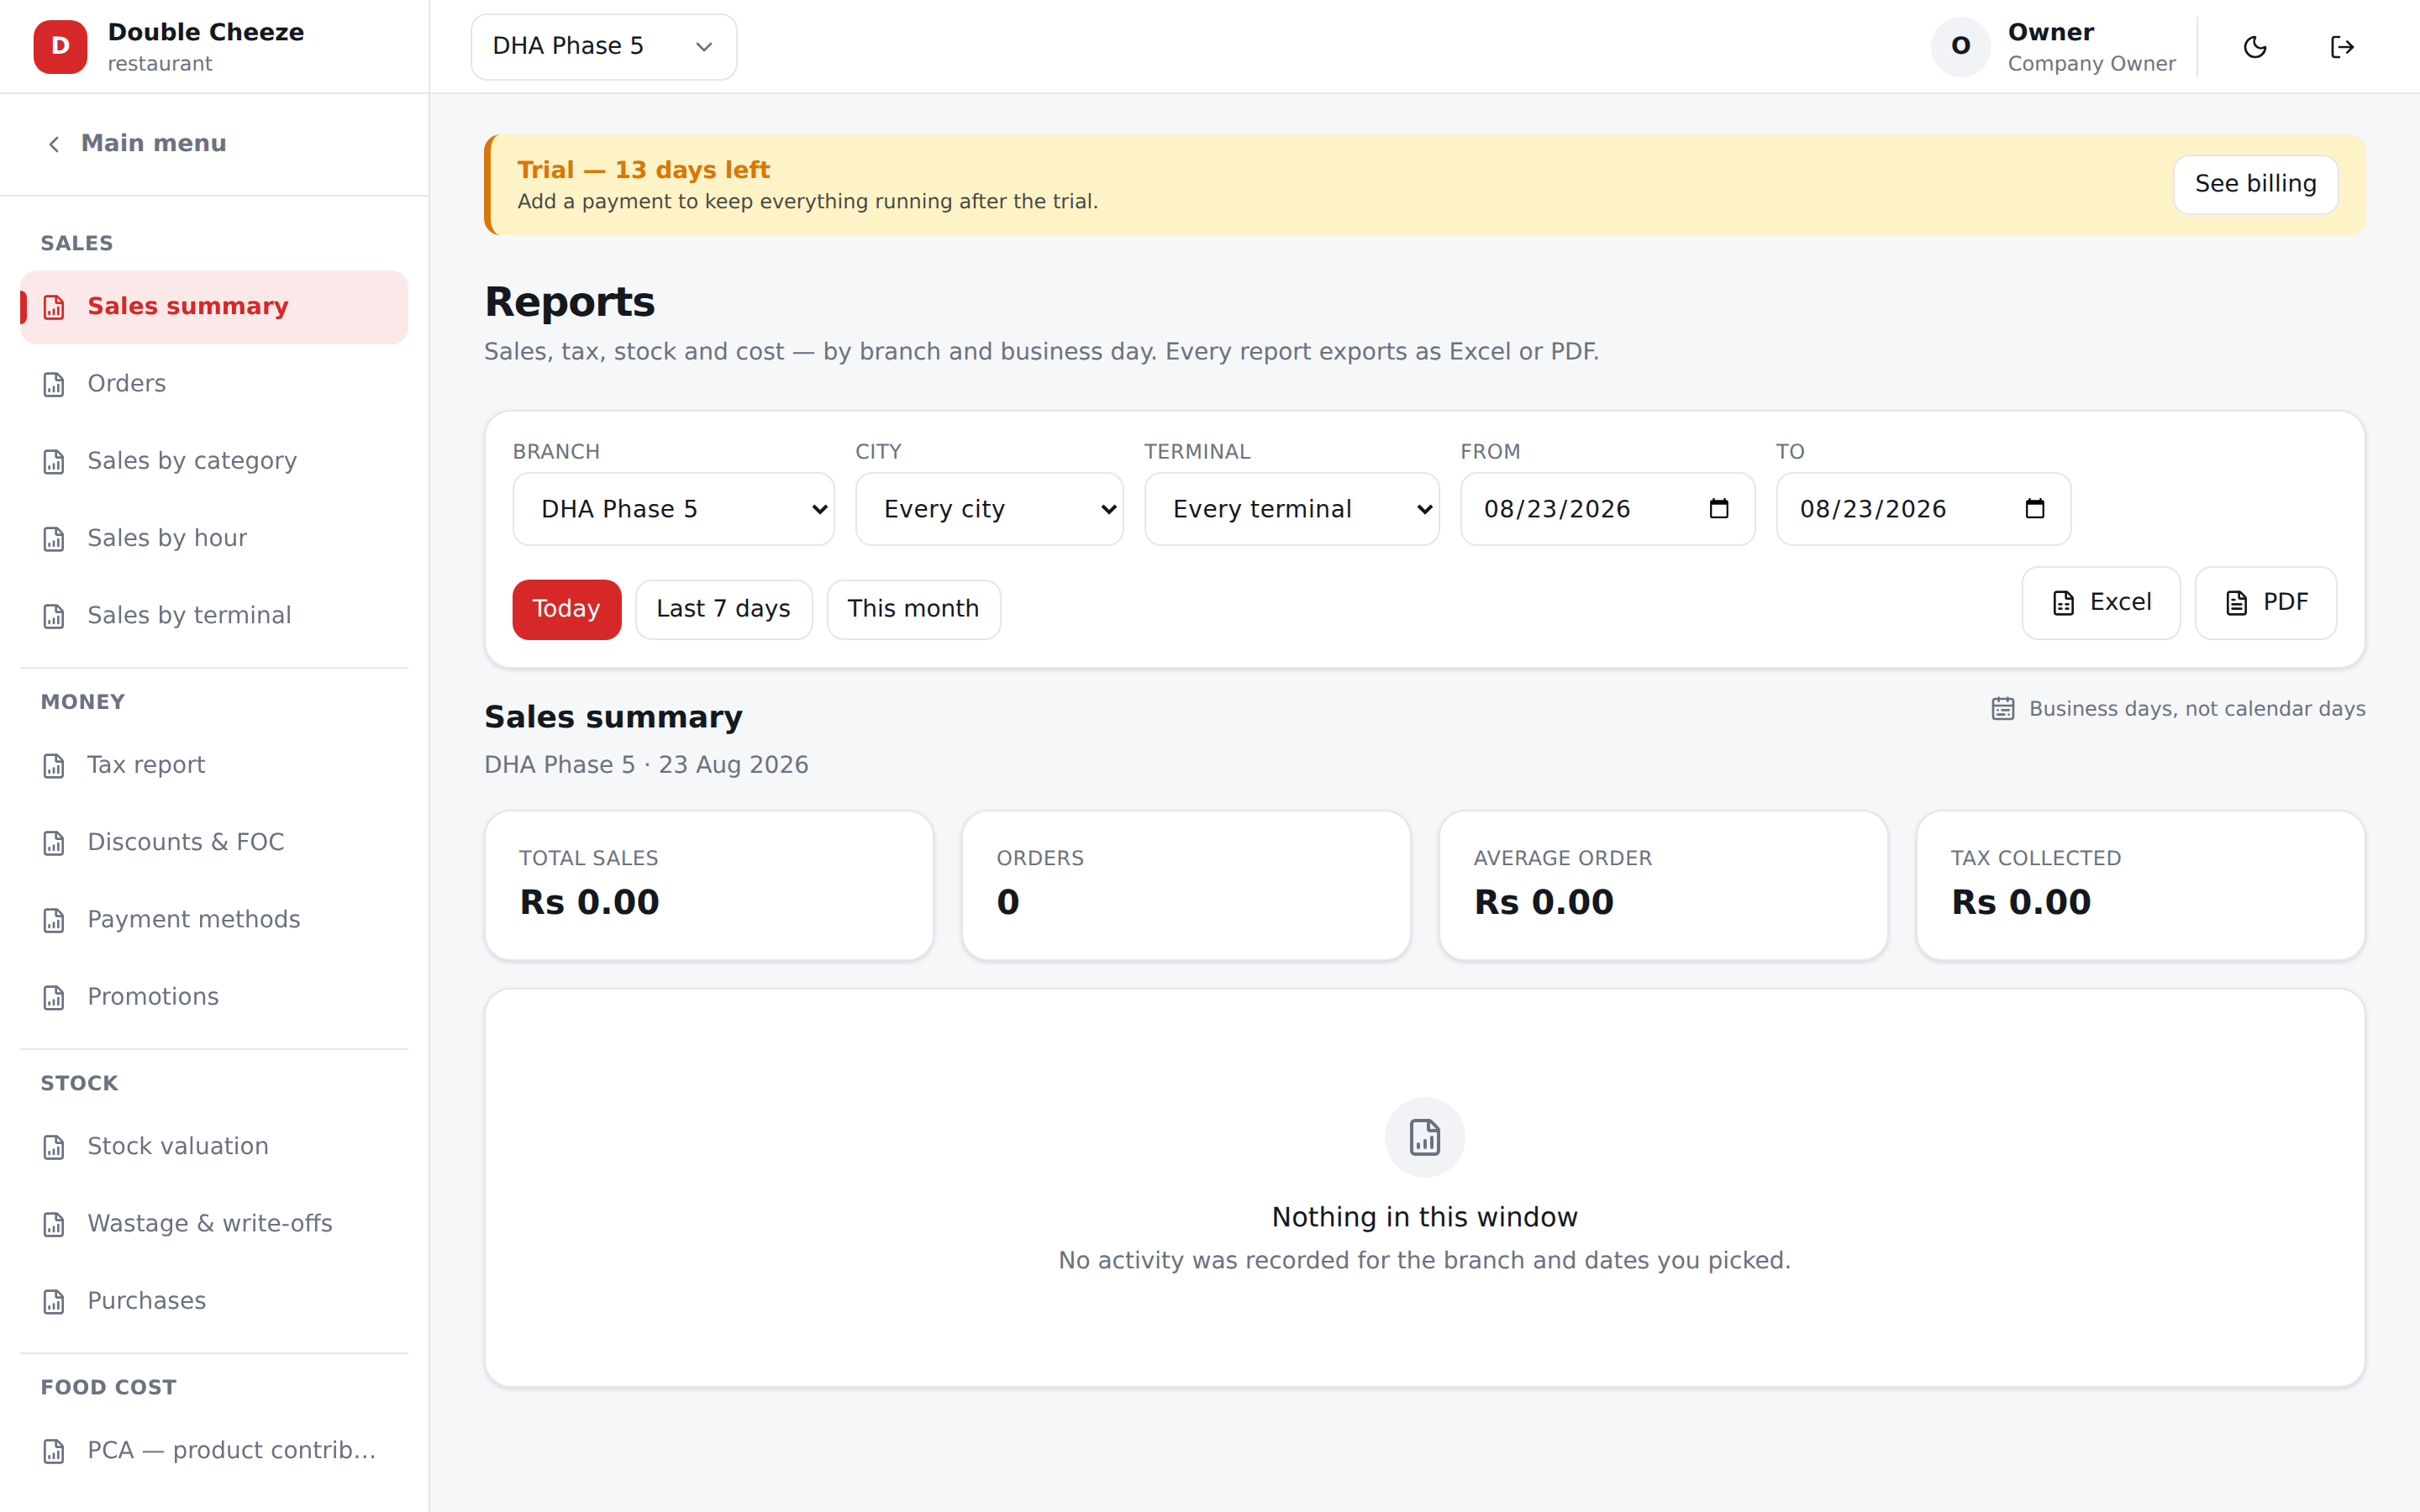
- The sidebar — while you are on this page the menu on the left becomes the list of reports your company can run, filed under Sales, Money, Stock and Food cost. The report itself then gets the whole width of the screen.
- Main menu — the button at the top of the sidebar puts the ordinary menu back. Press Reports in the same place to return to the report list.
- Top — branch (owners can pick "All branches"), From / To, and the quick buttons Today, Last 7 days, This month.
- Excel and PDF hand you the file.
On a narrow screen there is no sidebar, so the report is picked from a Report dropdown at the start of the filter bar instead.
Dates are business days, not calendar days: a 2am sale is reported on the day it was actually sold.
The exports are generated on the server from the very same figures the screen read, so a download can never disagree with what you were looking at.
The reports
The list is filed under headings, and a report your business type or your plan does not earn is refused by the server, not merely hidden — a pure retailer has no PCA, a pure restaurant has no margin report.
Sales
| Report | What it answers |
|---|---|
| Sales summary | Orders, gross, discount, net, tax, total and average order, per business day |
| Orders | Every completed order — number, time, type, cashier, totals, FOC flag |
| Sales by category | Where the money came from |
| Sales by product | Every product and variant, with what sold on its own and what went out inside a deal counted apart. The deal column reads 0.00 because the money is on the deal's own row — see below |
| Sales by hour | Your trading curve — which hours are worth staffing |
| Sales by terminal | Which till took what |
| Order segments | Phone work against counter work: source × order type. The only way to tell whether a new call desk is earning its keep |
| Price overrides | What was sold at a typed price, against what it should have been, by whom — see Price at the counter |
| Channel sales | Foodpanda and the rest against your own counter, on one page. Orders with no channel are the Counter row |
| Deal sales | Every deal you ran, what each one earned, and what went out inside them. Restaurants only — see below |
Sales by product counts a dish twice on purpose, in two columns. A deal is one line on the order pointing at the deal; the pizza inside it is written into that line's own snapshot. So "sold on its own" is what the counter sold as a pizza, and "sold in a deal" is what your Family Feast quietly made the kitchen produce. They are never added together, because they are different questions — the second one is how you decide whether the deal is worth running.
And the money stays on the deal. Your customer paid Rs 2,600 for a deal; they never paid "Rs 620 for the pizza", so nothing in Sellify says they did and this report will not invent it. The deal's own row carries the sale, and the component's column reads 0.00 — which is the truth, not a blank: that pizza earned nothing under its own name. The one exception is an upgrade the customer really paid for (a dearer crust at +Rs 150). That is the component's own money and it is shown as itself, under Upgrades paid.
Five filters sit above it, and they are not all the same kind of thing.
| Filter | What it does |
|---|---|
| Category | Only the products filed under one menu category |
| Find | A word from the product or variant name |
| Sold | Either way (the default), only what went out inside a deal, or only what sold on its own |
| Order type | Dine-in, takeaway, delivery or retail |
| Channel | One platform, or Counter only — what came through your own door |
Sold hides rows; it never changes a figure. Pick "Inside a deal" and the products that only ever sold on their own drop off the page — but the pizza that sold both ways keeps both its columns, because it really did sell both ways. A row that changed its numbers depending on a dropdown would be a row you could not trust.
"On its own" means sold that way at all, not "sold only that way". A pizza that goes over the counter and also rides inside a Family Feast is a true answer to both questions.
Category reads the dish, not the line it rode in on. Filter to Pizzas and the pizza inside a deal is still there — even though the order line says "Family Feast", which is filed under Deals. That is the whole reason this report exists.
The totals are the rows on the page. Filter the page and the figures at the foot of it follow, and the subtitle says what was narrowed — so an Excel or PDF export can never be mistaken for the shop's whole day.
Deal sales
Menu: Reports → Sales → Deal sales · Who: owner, branch manager · Restaurants only — a shop with no kitchen sells no deals.
Sales by product answers the dish's question. This one answers the deal's: which deal earns most, which one sells most, and what it is quietly making the kitchen produce.
Four figures at the top:
| Deals sold | How many went out, across every deal on the menu |
| Deal sales | What they earned, after each one's share of any order discount |
| Share of goods sold | What portion of your goods money came through a deal. The hint names the figure it is a share of, so there is nothing to guess |
| Top deal | The biggest earner by name — and underneath it, the one that sold most, which is very often a different deal |
Then two charts, then the table.
| Column | What it is |
|---|---|
| Sold | How many of that deal went out |
| Bills | How many orders carried it. Two lines of the same deal on one order is one bill |
| Gross | Before its share of any order discount |
| Discount | Its share of one |
| Net sales | What it actually earned — this is what "top deal" is ranked on |
| Upgrades paid | What customers paid on top to upgrade what was inside it |
| Share of deals | Its portion of all deal sales |
Underneath, What went out inside them: one row per item, how many went out, and what was paid to upgrade it. That is the Family Feast's pizza — the figure a kitchen orders against.
The charts are a picture of the table, never a second set of figures. Both plot columns that are already on the page, so they cannot disagree with it, and each one is capped at the top eight with the table underneath carrying the rest. They are read to rank, not to quote: every figure a bar draws is also printed beside it and in the table.
The two charts are not the same picture twice. Top deals by sales and Top deals by quantity answer different questions, and a cheap deal can lead the counter all month while coming fourth on the money. That is usually the most useful thing on the page.
There is no pie chart and there will not be one. Slices that differ by three percent look identical; the Share of deals column says it exactly.
Three filters, and they are the ones this report actually reads:
| Filter | What it does |
|---|---|
| Find | A word from the deal's name — it narrows the components table with it |
| Order type | Dine-in, takeaway, delivery or retail |
| Channel | One platform, or Counter only |
There is deliberately no category filter (every row here is a deal) and no Sold dropdown (this whole report is the deal side of that question). A control that narrows nothing is worse than no control.
Everything is read off each sale's own snapshot. Rename a deal, reprice it or take it off the menu tomorrow and last month's report does not move — and a deal you deleted still shows the month it sold in, rather than taking its own sales off the page with it.
Money
| Report | What it answers |
|---|---|
| Tax report | One row per authority + tax + rate, with tax split cash vs card, and the invoice list underneath — each invoice marked Sent, Kept back (the cashier answered No on the pay screen) or Not sent. Where anything was kept back it is listed on its own above the invoices, with who kept it back and at which till, and two figures say how much tax was sent and how much was kept back. This is what a filing is made from |
| Sales tax return | What you actually owe for the period: the tax you collected, less what came back on returns, less the input tax you paid on deliveries. The Tax report is the detail; this is the bottom line you file from. It is a working, not a filed return — check it against the authority's own portal before you send it |
| Payment methods | Cash / card / wallet / credit, count and amount |
| Discounts & FOC | What was given away, by reason, with the approver named. FOC counted separately |
| Promotions | What each campaign and code did |
| Channel settlements | What each platform owes you, what it paid, and the difference |
Food cost (restaurant)
| Report | What it answers |
|---|---|
| PCA | Per dish: quantity, net sales, theoretical cost, contribution and food cost % |
| Daily PCA | Per outlet per business day, with a city roll-up |
| Item consumption | Per stock-room category, and the items under it |
| Consumption comparison | Per item, against the branch's own counted closing |
| Consumption variance | Should-have-used vs actually-used, per ingredient. The gap is waste, theft or a wrong recipe |
| Margin (retail) | Net sales against the actual cost the sale took off the shelf |
A dish with no recipe is not costed at zero and buried — its sales are reported separately, because a percentage quietly reading low is worse than one that explains itself.
Customers (call centre)
| Report | What it answers |
|---|---|
| Customer list | Who they are, what they have spent, their stars |
| Dormant customers | Who has stopped ordering — the list worth ringing |
| Customers by city | Grouped on the customer's own city, not the branch's |
| Customer orders | One customer's history |
| Frequent customers | Who is worth keeping |
| Customer discounts | Who has a standing discount, at what, and who gave it |
| Complaints | By category, by branch, and what was done about them |
| Call centre agents | What each agent took |
These name people, so none of them is ever offered to the AI assistant.
Staff (staff meals)
| Report | What it answers |
|---|---|
| Staff meals | Per employee per month: allowed, used, what is left — see Employees and staff meals |
| Staff meals daily | The same, day by day |
Read by HR, the owner, and anybody the owner grants it to. Never offered to the AI assistant — salary and what the canteen costs are out of its reach entirely.
Delivery (call centre)
| Report | What it answers |
|---|---|
| Delivery performance | On time, late, failed, and the average minutes against the promise |
| Rider performance | What each rider carried, and their cash variance |
| Failed deliveries | Every one, with its reason. Names the customer, so it is never offered to the AI |
Stock
| Report | What it answers |
|---|---|
| Stock valuation | On-hand quantity × that branch's own average cost |
| Expiring stock | What is about to go off, soonest first, and what it is worth |
| Stock in transit | What left one branch and has not arrived at the other |
| Purchases | Supplier documents, goods, freight, and the input tax you can claim |
| Wastage & write-offs | Adjustments by reason, at cost |
Books (accounting)
| Report | What it answers |
|---|---|
| Trial balance | Every account, the balance it holds, and whether the two columns agree |
| General ledger | One account's own statement — brought forward, every line, closing |
| Income statement | Income and expenses off the general ledger, for the range |
| Balance sheet | Assets, and what funds them, as at a day |
| Cash book | The till, the box and the bank, day by day |
| Books reconciliation | Where the trading figures and the books disagree, and by how much |
These are the pages an accountant opens, and there is a chapter of their own — The books. Two things to know before you look: the trial balance and the balance sheet are as at a day and read the END of your range, and both are the whole company whichever branch is in the top bar, because a set of books narrowed to one shop does not balance. And they are read by the owner and by whoever the owner gives May read the books to — a branch manager does not get them by position.
Stock in transit
Sending a transfer takes the stock off the sending branch immediately — while it is on the road it belongs to neither shelf. So a transfer nobody remembers to receive leaves that stock nowhere at all: the branch that sent it is short and knows why, and the branch it was sent to is short and does not, because on its screens that stock has never existed.
This is the page that finds them.
- The main table is everything still standing, oldest first — what left, when, from where, to where, how many days ago and what it is worth. It ignores the date range on purpose, and the subtitle says so: the transfer worth finding is the one sent in January, which is exactly the row a range would hide.
- Pick one branch and a Direction column appears — Out is stock that branch sent and nobody has booked in, In is stock it is owed. Over all branches there is no "us" for a direction to be relative to, so the column is not drawn.
- The second table, Received short, is the other half of the same question, and it reads the date range. A receipt entered for three kilos against five sent says the missing two are never arriving — somebody has to chase them or write them off. It is counted apart from what is standing, because goods still in transit may yet turn up.
- Value is what the stock left the sending branch at. A commissary that issues at its own rate is charging one pocket of the company from another; what is actually standing in the van is what came off the shelf.
A receiving branch is also told on its own dashboard once a transfer is past the wait set in Settings → Inventory → Transfer expected within (days). A transfer sent an hour ago is a van on the road, not a mistake, so nothing is said until then.
Which way is the bad way
Some columns say so. Variance means over is bad, so a positive figure reads red. Shortfall means short is bad, so a negative figure reads red — a count variance is counted − expected, the shelf's own convention, so a missing kilo is a negative number.
A table past eight columns pins its first column, so the row keeps its name while the figures scroll.
Reading the two that matter most
PCA. Food cost % is theoretical cost ÷ net sales. Anything over about 40% deserves a look: either the recipe is wrong, the portion is too big, or the price is too low. The contribution column is what the dish actually leaves you after ingredients.
Consumption variance. If the kitchen should have used 12 kg of chicken and actually used 15 kg, that 3 kg is the number to chase. Wastage entries explain part of it; the rest is portioning or shrinkage.
Reading a whole city
A chain with three shops in Lahore reads its takings by city as often as by shop. The City filter beside Branch adds those shops up — the report says "Lahore · 3 branches" so there is no doubt what was counted.
Branch wins when both are set: naming one shop answers for that shop. A branch-bound manager is pinned to their own branches, and the city they ask for is ignored exactly as a branch id they do not hold is. A manager over several shops reads one at a time, off the same dropdown an owner uses — there is no total across a manager's own four shops, only across a city an owner asks about.
Stock on hand carries the same filter: pick a city and the quantities add up across its branches, valued at what those branches actually paid.